PTO World Ranking System Explainer
The PTO WRS is designed to measure and reward the performances of professional triathletes around the world.
It was overhauled in January 2023 following efforts from a Rankings Committee made up of PTO athlete members. Over a 14-month period, the committee worked hard to come up with a system that met the core principles of being simple, transparent, objective and fair – allowing fans, athletes and the media full access to the behind-the-scenes workings of the PTO WRS.
In 2026, it was updated again to increase the number of eligible races from three to four and remove a rule giving a 5% bonus to athletes’ best Gold or lower tier event.
"I believe that the system will make it easier for athletes to know what points they can expect from a race, and for fans to understand how those points were awarded. It also rewards good racing at the most competitive events, which is fundamental in progressing our sport"
Ruth Astle
2023 Athlete Rankings Committee Member
In A Nutshell
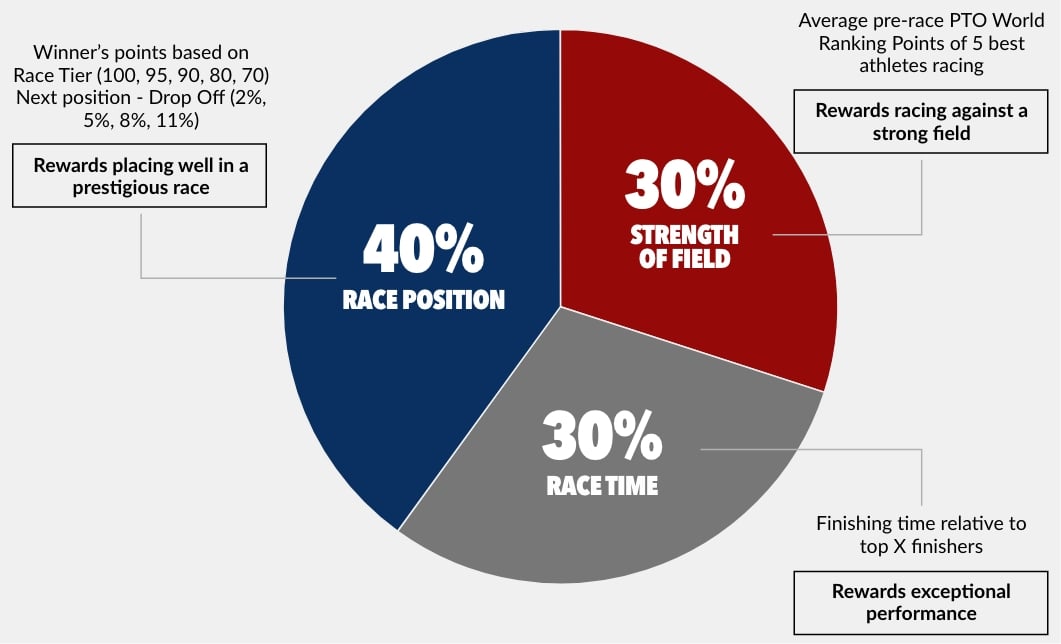
An athlete’s score in each race is based on several factors to make the system as fair as possible. The tier of a race (awarded based on race prestige and athlete remuneration) sets its base points level, the strength of field is taken into account, and an athlete’s finishing position and time relative to other finishers are also factored in.
This outputs a final score that rewards athletes consistently finishing in a strong position and time at the most competitive races with the biggest prize purses. Meanwhile, lower-tier races offer the opportunity for athletes to build their race resume and move up into the highest echelons of professional triathlon racing, such as the T100 Triathlon World Tour.


Eligible Races
Any non-drafting triathlon with a professional field that’s longer than Olympic distance (1500m swim, 40km bike, 10km run) and with a minimum prize purse of $10,000 is eligible for PTO World Ranking Points, bringing the sport together regardless of branding. This includes professional T100 Triathlon World Tour races, IRONMAN, IRONMAN 70.3, Challenge Family and Clash events as well as independent races meeting the minimum prize purse criteria. In addition, a gender-equal prize purse is mandatory – and also the norm across the vast majority of professional triathlon races.
How Do Athletes Score PTO World Ranking System Points?
The PTO WRS points allocation is split across three aspects: 40% comes from an athlete’s Race Position Score; 30% comes from the race’s Strength of Field (SOF); 30% comes from an athlete’s Race Time Score.
Race position score
40% of overall race score
A race’s tier sets its base points and the percentage drop-offs between finishing positions. Tiers are based on race prize money, availability of travel expenses and accommodation, payment of appearance fees, bonus programmes, media exposure, live broadcast/coverage and overall commitment to supporting professional athletes.
The PTO encourages race organisers to increase professional prize purses in order to ensure a higher tier allocation in the PTO World Ranking System. Races that do not automatically fall into a tier based on athlete remuneration will be assessed by the PTO with final tier allocations made at the discretion of the PTO Commercial board.
"The committee were all strong advocates of races being allocated into tiers… it encourages the best athletes to race the top tier events, which in turn, offers a lot of opportunity for lower ranked athletes to race gold/silver/bronze tier events and place better and earn better prize money."
Renee Kiley
2023 Athlete Rankings Committee Member
| tier | Description | example races* | base points | drop off(%) |
|---|---|---|---|---|
| Dlamond | >=$500k | T100 Races, Ironman World Championships, Ironman 70.3 World Championships | 100 | 2 |
| Platinum | >= $350k to < $500k | There were no Platinum events in 2024 | 95 | 2 |
| Gold | >= $75k to < $350k MD* >= $150k to <$350k FD** |
Most IM & 70.3 Regional Championships, Challenge Roth, Challenge Family The Championship, World Triathlon Long Distance World Champs | 90 | 5 |
| Silver | >= $25k to < $75k MD* >= $50k to <$150k FD** |
Most Challenge Family events, many Ironman 70.3 and Ironman races, Clash Miami, some independent races | 80 | 8 |
| Bronze | >= $10k to < $25k MD* >= $10k to < $50k FD** |
Some Challenge Family events, smaller independent races | 70 | 11 |
* MD= Races less than 3.8k / 120k / 30k
** FD = Races over 3.8k / 120k / 30k
Tier allocation for some races take into account series prize purses such as the T100 Standings, Ironman Pro Series or Challenge Family World Bonus.
Tiers, therefore, give athletes a better idea of the points likely to be earned from a good performance at a particular event, helping them to better plan their season of racing.
The winner of each race is awarded the full Base Points score for the event as their Race Position Score. Athletes who finish behind the winner are scored based on the Drop Off percentage value in relation to the previous athlete’s score.
| Diamond | Platinum | Gold | Silver | Bronze | |
|---|---|---|---|---|---|
| Drop off % | 2 | 2 | 5 | 8 | 11 |
| 1 | 100 | 95 | 90 | 80 | 70 |
| 2 | 98.00 | 93.10 | 85.50 | 73.60 | 62.30 |
| 3 | 96.04 | 91.24 | 81.23 | 67.71 | 55.45 |
| 4 | 94.12 | 89.41 | 77.16 | 62.30 | 49.35 |
| 5 | 92.24 | 87.62 | 73.31 | 57.31 | 43.92 |
| 6 | 90.39 | 85.87 | 69.64 | 52.73 | 39.09 |
| 7 | 88.58 | 84.16 | 66.16 | 48.51 | 34.79 |
| 8 | 86.81 | 82.47 | 62.85 | 44.63 | 30.96 |
| 9 | 85.08 | 80.82 | 59.71 | 41.06 | 27.56 |
| 10 | 83.37 | 79.21 | 56.72 | 37.77 | 24.52 |
| 11 | 81.71 | 77.62 | 53.89 | 34.75 | 21.83 |
| 12 | 80.07 | 76.07 | 51.19 | 31.97 | 19.43 |
| 13 | 78.47 | 74.55 | 51.19 | 31.97 | 19.43 |
| 14 | 76.90 | 73.06 | 46.20 | 27.06 | 15.39 |
| 15 | 75.36 | 71.60 | 43.89 | 24.90 | 13.69 |
| 16 | 73.86 | 70.16 | 41.70 | 22.90 | 12.19 |
| 17 | 72.38 | 68.76 | 39.61 | 21.07 | 10.85 |
| 18 | 70.93 | 67.39 | 37.63 | 21.07 | 9.65 |
| 19 | 69.51 | 66.04 | 35.75 | 17.83 | 8.59 |
| 20 | 68.12 | 64.72 | 33.96 | 16.41 | 7.65 |
Colours show comparative Race Position Scores across different tier levels.
race position score example
- Race Position Score for 1st in Diamond Tier event: 100
- Race Position Score for 2nd in Diamond Tier event (2% drop-off): 98
-
100 * (1 - 2 / 100) ^ (2 - 1) = 98
^ = to the power of - Race Position Score for 3rd in Diamond Tier event (2% drop-off): 96.04
- 100 * (1 - 2 / 100) ^ (3 - 1) = 96.04
- Race Position Score for 4th in Diamond Tier event (2% drop-off): 94.12
- 100 * (1 - 2 / 100) ^ (4 - 1) = 94.12
The above calculation for third place could also be achieved as 98 – (98*0.02)
The drop-offs were designed by the athletes on the rankings committee to help qualify the relative performance of athletes across tiers. For example, placing 1st in a Silver Tier race would equate to a relative placing of 12th in a Diamond Tier race.
Strength of field score
30% of overall race score
Greater strength in depth means athletes have to put in stronger performances to do well against tough competition. The SOF Score is designed to reflect that and is based on the PTO World Rankings. A race’s final SOF Score is calculated based on the average ranking points of the top-five athletes who start the race (regardless of any eventual DNFs).
If there happen to be fewer than five ranked athletes racing, the sum of the competing athletes’ scores is still divided by five to get the average.
sof score example
- Athlele 1: 98
- Athlete 2: 85
- Athlete 3: 66
- Athlete 4: 61
- Athlete 5: No athlete
- (98 + 85 + 66 + 61 + 0) / 5 = 62
Race time score
30% of overall race score
Race position and strength of field alone can’t truly evaluate an athlete’s performance on the day compared to the rest of the field. By also factoring in athletes’ finishing times relative to their competition, there is a fairer spread of points befitting both exceptional performances at the pointy end of the race and slower times throughout the results sheet.
Firstly, two baselines are set – the Baseline Score and the Baseline Time.
The Baseline Score is the average of Tier Base Points and SOF Score.
The Baseline Time is the average finishing time of athletes based on:
- 4 or fewer finishers = 1st place time only
- 5 to 8 finishers = average of 1st and 2nd place times
- 9 to 12 finishers = average of top 3 athletes’ times
- 13 to 16 = average of top 4 athletes’ times
- More than 16 = average of top 5 athletes’ times
An athlete’s final Race Time Score is calculated by starting with the Baseline Score and adding or deducting 6 points for every 1% that they’re faster or slower than the Baseline Time. An athlete’s Race Time Score cannot fall below 0 regardless of how far behind the Baseline Time they finish a race.
race time score example
- From PTO US Open 2022 Women's Race
- Baseline Score = 93.17 (average of 100 Tier Base Points and SOF of 86.33)
- Baseline Time = 3:40:57 (based on average of top 5 finishers: 3:37:17, 3:38:32, 3:40:31, 3:43:37, 3:44:49)
- Race Time Score for 1st place athlete= 103.13 (Faster than Baseline Time by 1.66% * 6 points = 9.97 points, 93.17 + 9.97 = 103.13)
- Race Time Score for 2nd place athlete= 99.74 (Faster than Baseline Time by 1.1% * 6 points = 6.57 points, 93.17 + 6.57 = 99.74)
- Race Time Score for 3rd place athlete= 94.35 (Faster than Baseline Time by 0.2% * 6 points = 1.19 points, 93.17 + 1.19 = 94.35)
- Race Time Score for 4th place athlete= 86.02 (Slower than Baseline Time by 1.19% * 6 points = 7.15 points, 93.17 - 7.15 = 86.02)
Overall race score
An athlete’s Overall Race Score is calculated as 40% of an athlete’s Race Position Score, 30% of the SOF Score and 30% of an athlete’s Race Time Score.
overall race score example (PTO US Open 2022 Women's Race)
| Finish Position and Time | Race position score (40%) | Sof score (30%) | Race time score (30%) | Overall race score |
|---|---|---|---|---|
| 100 For 1st Place in Diamond Tier | Average pre-race ranking points of top 5 athletes who start the race | Baseline Score = average of Tier Base Points and SOF Score (100+86.33/2) = 93.17 Baseline Time = average time of top 5 finishers = 3:40:577 |
40% Race Position Score 30% SOF Score 30% Race Time Score |
|
| First place 3:37:17 |
100.00 Full Tier Base Points |
86.33 | 103.13 Faster than Baseline Time by 1.66% * 6 points = 9.97 points 93.17 + 9.97 = Race Time Score |
96.84 (0.4 * 100) + (0.3 * 86.33) + (0.3 * 103.13) |
| Second place 3:38:32 |
98.00 100*(1-2/100)^(2-1) |
86.33 | 99.74 Faster than Baseline Time by 1.1% * 6 points = 6.57 points 93.17 + 6.57 = Race Time Score |
95.04 (0.4 * 98) + (0.3 * 86.33) + (0.3 * 99.74) |
| Third place 3:40:31 |
96.04 100*(1-2/100)^(3-1) |
86.33 | 94.35 Faster than Baseline Time by 0.20% * 6 points = -1.19 points 93.17 + 1.19 = Race Time Score |
92.62 (0.4 * 96.04) + (0.3 * 86.33) + (0.3 * 94.35) |
Changes to the 2023 System
In 2023, an athlete’s best full-distance score within the Gold, Silver or Bronze tiers was rewarded with a 5% score boost.
In 2024 this was extended to all distances. In 2026, the PTO Athlete Board removed the 5% bonus entirely.
From 2023 to 2025, athletes’ overall ranking scores were made up from three eligible events. From 2026, this changed to four events.


PTO World Ranking System Calculations
An athlete’s overall PTO WRS score is calculated as the average of their top four Overall Race Scores within a rolling 52-week period.
In this way the PTO WRS rewards those athletes who perform well consistently at the biggest races with the toughest competition.
If an athlete has fewer than four Overall Race Scores within the 52-week rolling period, missing scores in the calculation are treated as zero. This is why some athletes might appear to drop down the rankings suddenly (as an older race score ‘ages-out’) or rocket up the rankings (as they add a fourth qualifying score).
The athlete with the most points becomes the custodian of the PTO World #1 title with the remaining PTO World Rankings assigned in descending order of PTO World Ranking Scores.
The PTO endeavours to provide PTO WRS scores as quickly as possible after a race once race results have been confirmed. This is typically within 24 hours of the race finish provided there are no extenuating circumstances to consider such as reduced distances or cancelled disciplines in an event. However, the overall PTO World Rankings won’t be updated until its regular update slot, which is typically on a Wednesday.
With the PTO World Rankings System being an ‘open maths’ system, scores can be theoretically calculated as soon as final results are in and confirmed. However, because scores are tied to the overall PTO World Rankings, which are updated on a Tuesday – and because it would be confusing to have scores for athletes’ results that aren’t referenced in the overall rankings – points for races will be published alongside the new PTO World Rankings each Tuesday.
The PTO WRS was overhauled in January 2023 for several reasons. Firstly, the previous system was a starting point developed to reward fast performances around the world regardless of other athletes racing. While this helped establish the system during the global pandemic, as triathlon racing becomes ever more competitive and fans clamour to see the best athletes racing together more regularly, a new system that encourages and rewards this was required.
The PTO also listened to the feedback on the previous ‘closed’ system, which made it hard for athletes and fans alike to work out how and why a particular performance was scored as it was. The new system is more transparent, with the maths available on this page showing exactly how each aspect of the system is calculated.
Finally, the inclusion of Race Tiers makes it easier for athletes to plan their seasons – both in terms of point scoring and prize money – and, by extension, the higher-quality fields likely to congregate at these events.
The 2023 PTO World Ranking System was developed by an Athlete Rankings Committee made up of a group of five current professional athletes – Ruth Astle, Antony Costes, Renee Kiley, Jackson Laundry and Danielle Lewis. PTO Membership Secretary, Dylan McNeice, and the PTO’s Rankings and Race Data lead, Thorsten Radde also acted as consultants in the process.
The PTO Rankings Committee started with just tiers and positions but this didn’t yield a system that achieved the core principles of it being simple, transparent, objective and fair. Any two athletes who won three races in the same tiers would also end up on exactly the same points.
SOF was then introduced to indicate the level of competition at each event, which directly impacts the race dynamics and outcomes. This improved the system but there were still outlying results, while exceptional performances weren’t fairly rewarded.
Finally, the time element was added, which gave a comparison within each race result of relative performance – highlighting outstanding performances of the athletes.
The PTO also listened to the feedback on the previous ‘closed’ system, which made it hard for athletes and fans alike to work out how and why a particular performance was scored as it was. The new system is more transparent, with the maths available on this page showing exactly how each aspect of the system is calculated.
Finally, the inclusion of Race Tiers makes it easier for athletes to plan their seasons – both in terms of point scoring and prize money – and, by extension, the higher-quality fields likely to congregate at these events.
The 2023 PTO World Ranking System was developed by an Athlete Rankings Committee made up of a group of five current professional athletes – Ruth Astle, Antony Costes, Renee Kiley, Jackson Laundry and Danielle Lewis. PTO Membership Secretary, Dylan McNeice, and the PTO’s Rankings and Race Data lead, Thorsten Radde also acted as consultants in the process.
Many different iterations of weightings for position, strength of field and time were considered by the Athlete Rankings Committee. The scores that resulted via a split of 40%/30%/30% gave fair weighting to all three elements, taking into account feedback on the previous PTO WRS that races should be tiered, race positions should count and that strength of field matters without removing the element of race finish time completely.
How race organisers support professional triathletes is one of the biggest factors in selecting a race tier. Sometimes, this isn’t simply the prize money available on the day, but expenses for travel, providing accommodation, offering appearance fees or end-of-season bonus payouts. The PTO also considers the impact a race might have on the profile of the professional athletes racing including media exposure, live broadcast/coverage or the overall commitment to lifting athletes and the overall profile of the sport.
The PTO encourages race organisers to increase professional prize purses in order to ensure a higher tier allocation in the PTO World Ranking System. Races that do not automatically fall into a tier based on athlete remuneration will be assessed by the PTO with final tier allocations made at the discretion of the PTO Commercial board.
The drop-offs are different for each tier so athletes’ performances are scored fairly based on the tier in which they’re racing. So, coming 2nd in a Diamond Tier race requires a relatively stronger performance than coming 2nd in a Silver Tier race. The drop-offs were formulated and tested by the athletes on the Athlete Rankings Committee to help ensure scores would be comparable across the tiers, hence placing 1st in a Silver Tier race would equate to a relative placing of 12th in a Diamond Tier race.
Race Time Score is scaled to the number of athletes racing to help ensure fair points by referencing a representative example of the field. If the number of racing athletes wasn’t considered, the baseline points for races with smaller finishing fields could be unfairly weighted.
The Athlete Rankings Committee tested a variety of different percentage and points configurations to determine how points should be increased or decreased based on an athlete’s finishing time. Six points for every 1% increase or decrease resulted in points that balance the reward for exceptional performances while also recognising slower performances without unfairly weighting either way.
In short, it doesn’t. Athletes who are offered a wildcard invitation to T100 or other organisers’ events are treated the same as any other PTO professional, regardless of their palmares. That means that even a multiple World Champion or Olympian would need a PTO WRS score within the top-five athletes who start the race to affect the event’s SOF score.
The most common reason for an athlete suddenly dropping several positions in the rankings is due to an event ‘ageing out’ by no longer falling within the rolling 52-week period. In such a situation, the aged-out race might be replaced either by a lower-scoring result or no result at all – dropping the athlete’s average substantially.
The most common reason for an athlete to suddenly jump up the rankings is due to a third result being added to their World Ranking. This means that rather than the sum of two races being divided by three to calculate their average, the sum of three races is divided by three instead, resulting in a much larger figure. Meanwhile, an athlete who replaces a poor result with a much higher scoring one would see a similar leap in their overall points and likely, a jump up the PTO World Rankings.
While an athlete might have an astonishing performance to secure a T100 Triathlon World Championship or IRONMAN World Championship title, consistency over four events within the rolling 52-week period is crucial for an athlete to rank highly in the PTO World Rankings. An athlete with one standout world championship performance and three lesser results is therefore unlikely to topple an athlete with four outstanding performances across the season.
In some rare situations, different race divisions may be assigned different Race Tiers in the same race – such as when a race is awarded regional championship status (and therefore more prize money) but only for one gender’s division.
As each race is scored in isolation with no reference to historical times, all calculations for an event can be completed as normal even if part of the race is shortened.
Individual discipline scores for swim, bike and run are calculated using the same process above. Race Position Score is calculated as the finishing position within each single discipline (excluding any transition times). SOF Score is calculated as the average of the top five single-discipline scores for athletes who start the race. The Baseline Score used in part to calculate Race Time Score is calculated via the Tier Base Points and single-discipline SOF Score. The Baseline Time used in part to calculate Race Time Score is calculated via the number of athletes completing the single discipline.
The rankings for 2022 and earlier remain exactly as they were with no retrospective changes made based on the system implemented in 2023. However, the scores you see on the PTO website for 2022 races reflect the 2023 (and onwards) system as it is these scores that contribute to an athlete’s current PTO World Ranking until they age-out under the 52–week rolling period.
While an athlete can’t calculate the exact points they would score for completing a race in a certain position, the Tier Base Points give a strong indication of the points available, helping athletes plan their season. As the race nears and start lists become available, the SOF can also be calculated, helping athletes hone the range they can expect to score in. Of course, it’s the final performance in the race that really counts – it’s not over until they’ve crossed the finish line!
In order to improve on the previous PTO WRS, a new Athlete Ranking Committee was formed. For over a year, the committee proposed and tested new ideas to come up with a totally new system that is both fair and transparent. To achieve this, the committee took into account as many aspects of professional racing as possible while answering athletes’ criticisms of the previous system, balancing a variety of conditions to produce a robust system that’s impartial with open maths calculable by anyone.
Athletes need to race four times per year to get their ‘best-four’ average. They only need to race more than this if they were unhappy with a performance or believe they have improved and can race faster to replace a previous score with a better one.
There are relatively few Bronze Tier events – mostly independent, local races meeting the minimum prize purse criteria. Meanwhile, there is a wide array of Silver Tier events available to developing athletes at many locations around the world. To enter the top 100 in the PTO WRS, an athlete is likely to need an average of around 60-70 points. So, starting at 0 points, four strong Silver Tier performances (which feature Base Tier Points of 80) in a season would likely see them move into the top 100. From there, it’s their performances that will continue to do the talking as they improve, win prize money, gain sponsors, take part in bigger, more competitive events and earn each step up the PTO World Ranking System.
TO OUR ATHLETES
The PTO would like to thank the athlete members of the Athlete Rankings Committee for their hard work and dedication in establishing the PTO World Ranking System: